User friendly interface
Different chromosomal parameteres
Software and hardware requirements - IdeoKar is designed for standard personal computers with the operating systems Microsoft Windows 7 or 8. There is no requirement to any specific type of hardware.
Overall software design and architecture
Here, we present a karyotype analysis software called IdeoKar for calculation of chromosomal and karyotypic parameteres and to build ideograms. The software consists of three windows (Figure 1). The core window is used for opening images, scale bar definition, chromosome tracing and numbering and chromosomal landmark definition. The second window is used for presentation of chromosomal and karyotypic parameteres. The parameters that are calculated are described in the table 1. The ideogram of the traced chromosomes is generated in the third window of the software. Providing that Ideokar is calibrated, a scale bar is placed on the ideogram.
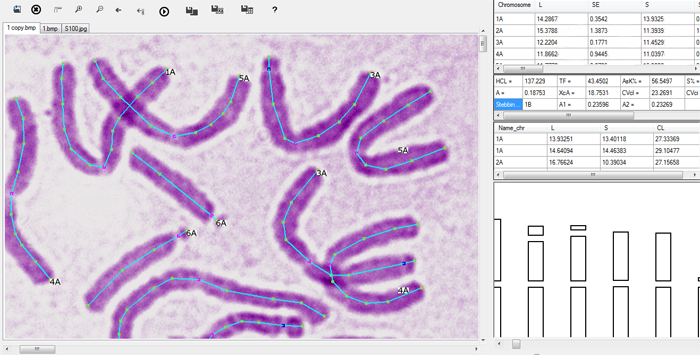
Figure 1. Ideokar software in which the chromosomes of Nigella sativa have been traced and the chromosomal and karyotypic data and the related Ideogram have been generated on the right side.
Icon guide
The guide to the icons of the IdeoKar software is summerized in the following picture:
![]()
Figure 2. Description of different icons of Ideokar
Length measurements and point marks
The user first open different metaphase images belonging to the same genotype which has been taken in the same condition and magnification. The images will be opened each in a tab. IdeoKar supports files with anyone of the bmp, gif, jpg, png and tif formats so there should be no need to convert the originally acquired image.
Calibration
1. Open an image. Use the icon ![]() for opening images.
for opening images.
2.
Identify a line in the image of which the length is known, and then click the calibration icon ![]() . Then click one end of that line.
. Then click one end of that line.
3
Click the other end of the line.

4. Enter the real length.
5.
Click OK.
Then in each tab the user traces each chromosome on the computer screen using the mouse clicking and holds specific keys in specific points such as telomeres, centromere, Secondary constriction or 45S rDNA, 5S rDNA etc. to introduce them to the program.
Tracing chromosomes
1. Each chromosome is marked by creating a series of connected line segments, which combined represent the length of the structure. A single click marks the start point of a chromosome.
2. By moving the cursor, the user decides how long each line segment should be. A single-click is used to mark the start of each consecutive line segment in a tracing. The tracing color has been set to cyan.
3. When you reach a point-like structures such as centromere, NOR or 5S rDNA must be marked as they are encountered. Centromeres are marked by right-clicking and selecting Centromere from the context menu, or by holding Ctrl and pressing C key. A pink point indicates the location of the centromere:
Ctrl + C: Centromere
Ctrl + N: 45S rDNA or secondary constriction
Ctrl + S : 5S rDNA
Ctrl + H: Heterochromatin
Ctrl + F: End of chromosome
4. Heterochromatin command is used to indicate the start and end of a Heterochromatin segment after single clicks. Note: When the start or end point of a heterochromatin segment is exactly on centromere poin, the user must mark centromere at first and then mark the start or end point of the heterochromatin.
5. Marking proceeds until the end of the chromosome is reached. The end of the current chromosome is indicated by right-clicking and selecting Finish from the context menu, or by holding Ctrl and pressing F key.
6. A small window will be automatically opened after tracing each chromosome, asking the number of the chromosome and its genome or subgenome. The user may distinguishes the number of homologous group and the genome that each particular chromosome belongs to.

6. Additional chromosomes can be marked the same way in all opened images.
Once the marking of chromosomes and related features has been carried out, the user may select the Run key ![]() to perform calculations and generate ideogram. Measurements are calculated from this tracing and different chromosomal and karyotypic parameters (Tables 1, 2 and 3) will be calculated and appeared in the data sheet of the software (Figure 1). The data can also be stored as a text file. The software uses this data to generate a ideogram image which can be saved as anyone of the pixed based image format (Add the file extension yourself while saving image). Figure3 shows an IdeoKar screen image in which three metaphase chromosomes of wheat (Triticum aestivum) have been traced. Euchromatic and heterochromatic regions are treated as segments.
to perform calculations and generate ideogram. Measurements are calculated from this tracing and different chromosomal and karyotypic parameters (Tables 1, 2 and 3) will be calculated and appeared in the data sheet of the software (Figure 1). The data can also be stored as a text file. The software uses this data to generate a ideogram image which can be saved as anyone of the pixed based image format (Add the file extension yourself while saving image). Figure3 shows an IdeoKar screen image in which three metaphase chromosomes of wheat (Triticum aestivum) have been traced. Euchromatic and heterochromatic regions are treated as segments.
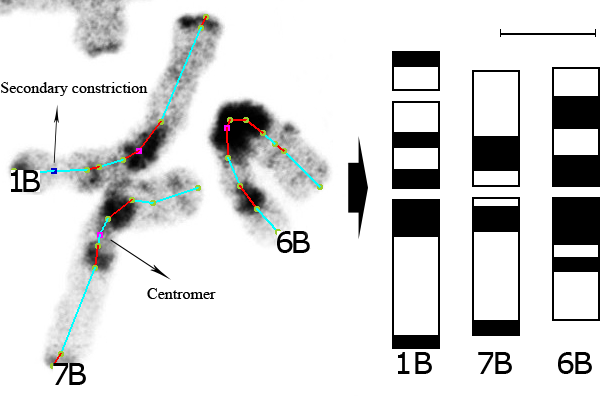
Figure 3. Tracing of three wheat chromosomes (1B, 6B and 7B) and the relevant ideogram whoch has been generated by IdeoKar. Providing that Ideokar is calibrated, a scale bar corresponding to 5 micrometer is placed on the ideogram.
IdeoKar has a simple environment and it is capable to simultaneously draw different ideograms of different species, subspecies or individuals into a single image file. This capability enables us to generate the ideogram of allopolyploid plants as well. Allopolyploidy is very common among plant species and an allopolyploid has two or more different genomes in the cell. Chromosomes of each genome in the ideogram of such an allopolyploid individual are appeared in a separate row so that there would be more than one row of chromosomes in the generated ideogram.
Table 1. Measures and formula of chromosomal parameters and karyotype asymmetry indices used in the IdeoKar program
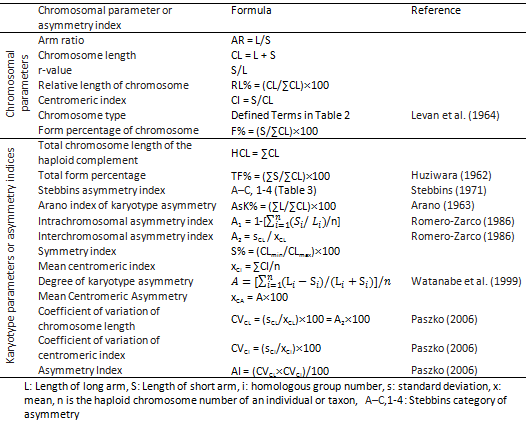
Table 2. The nomenclature used for the description of chromosome morphology is that proposed by Levan et al. (1964)

Table 3. The classification of karyotypes in relation to their degree of asymmetry according to Stebbins (1971)

Save the Ideogram
The Idogram can be saved as each of the pixel based format files comatible with Windows such as GIF, JPG, PNG, TIF. For this, click the ![]() icon and input a name along with the extension of the desired file format (For example filename.png or filename.jpg). Saving in png format gives a transparent background which is preferred for printing or for converting to pdf file in Adobe Acrobat.
icon and input a name along with the extension of the desired file format (For example filename.png or filename.jpg). Saving in png format gives a transparent background which is preferred for printing or for converting to pdf file in Adobe Acrobat.
For converting the ideogram file to PDF format follow the following steps:
- Open Adobe Acrobat.
- Go to File > Create PDF > From File …
- Open the file
- Savet the file as PDF
Save the data
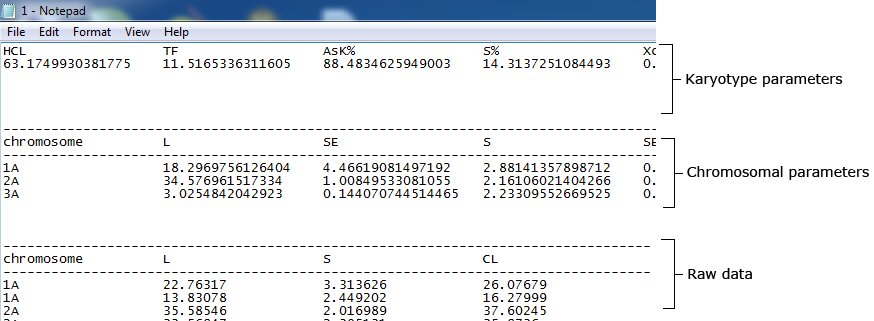
After tracing chromosomes, all the related data in the tables can be stored in a Notepad file which includes three parts (Karyotype parameteres, Chromosomal parameteres and raw data). In order to save the data, pres the ![]() icon.
icon.
| *** When opening the saved data file in the Notepad, deselected the "Word-Wrap" in the Format menu: | 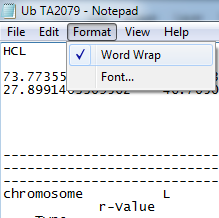 |
*** If you were interested, the Notepad output file can be opened in Excel software. select 'Delimited' and then 'Space' duing opening!
